In part four of OpenSymmetry’s seven-part blog series on effective sales compensation plan design, we’ll discuss the power of an optimized payout curve and how to establish one. To start from the beginning of the series, follow this link to blog one.
Incentive compensation payout curves are a challenging component of sales bonus plans. A payout curve determines commission payout as determined by performance against target. One must consider the concern around seller role, cost to company, motivating all sellers, managing behaviors to maximize sellers’ full potential, and mitigating negative behavior.
A scheme articulates the level of payout for on-target sales performance. Once that point is anchored, what happens below target? How do you keep the lower and higher performers engaged? The other key points on the payout curve include:
- Threshold: the point below which there is no payout — the minimum point of sales performance in order to receive incentive compensation.
- Point of Excellence: the point where sellers hit targets beyond payout.
- Cap: the point above which there is no further payout, irrespective of further sales by sellers.
Why is the payout curve important?
In designing a sales compensation plan, organizations attempt to match the role and opportunity. Additionally, you must make sure the money goes to the right people for the right level of performance and aim to maximize seller motivation by reflecting an understanding of the selling environment. There is a clear dependency on territory alignment and quota setting. All this to say, there are many factors that can impact the shape of the payout curve.
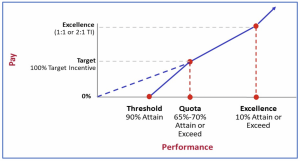
Ideally, a payout curve should effectively discriminate based on performance. A widely held guideline for effective payout curves is that 90% of sellers should reach threshold, 60-70% should reach target, and 10% reach the point of excellence. The higher the target setting accuracy, the more aggressive you can be with pay structure design with higher thresholds and a steeper curve post the point of excellence.
Consider the three groups of sellers according to relative performance:
- The low performers who do not reach threshold might be new in the role, have picked up new accounts or territories that need development, or are just not fit for the role. This group needs training and encouragement to improve.
- The “mighty middle” are those who attain quota but do not hit the point of excellence. The art is to extract an extra 5-10% performance from this group.
- The third group are the high performers who will flourish whatever the challenge but need to be encouraged to keep pushing after they have achieved their target.
The payout curve can motivate or frustrate each of these groups.
Another consideration for forming the payout curve is the selling environment which may affect the accuracy of quota setting. In more stable environments where targets are more predictable, it may be most effective to set a higher threshold and be more aggressive on the shape of the curve after the point of excellence. In more volatile environments, however, there is a need for more leeway for seller performance to reach target. This should result in a lower threshold and a shallower curve after the point of excellence to match the selling environment.
What are the considerations for setting the threshold value?
Should there be a threshold, and if so, what is the right level? A survey by Mercer in the UK indicates that 70% of plans have thresholds with a median level of 80% of target. Many companies not using thresholds find that a lot of the commission spend is going to underperforming sellers, so the key point of the threshold is to prevent that.
As you consider setting a threshold value, a key consideration is the sales role.
For an account manager role, there will be a sales history and future sales expectation for each account considering client strategy, new products, and impending contract renegotiation. So, there will be a sales number for the current financial year, either revenue or net sales. There will also be a target sales number for the next financial year. If this target incorporates sales that are already in the pipeline or where the client has committed spend through a multi-year contract, you will be able to assess the level of sales which, although not absolutely guaranteed, are highly probable. You don’t really want to reward the seller for these sales. Most of the sales would happen if the account manager wasn’t there. You really want to incentivize account growth. In this situation, if the existing portfolio is 80% of the new FY target, the threshold should be set at 70% or 75% of target. The 5-10% gap acknowledges that some portfolio retention will require effort from the seller. You particularly want to avoid the ‘Leaky Bucket’ scenario where existing accounts are lost through a focus on winning new clients. Threshold level performance may only generate 50% of target payout. However, the payout curve can then ramp up steeply up to target.
If, on the other hand, the seller is focused entirely on new logo sales with no existing client portfolio, paying from Sale 1 is a better approach. There is no threshold as such, but it is common to find a shallower payout curve or commission rate up to a level of performance vs target. This can be lower (50% of target) or higher (80% of target) depending on the nature of challenge in the market. You expect 90% of your hunters to get to this level. Then the curve can ramp up to target.
Optimal threshold values will vary by company, and even in different seasons at the same company, so this concept is worth revisiting at different stages in the company’s growth.
What are the considerations for setting the point of excellence?
The point of excellence is the level you would expect from your top 10th percentile performer. For many tech companies, this is the group that typically hits numbers between 120-130% of target. In new, emerging businesses it could even reach 200% of target. Or in sectors such as oil and gas, this could mean those who hit 102% of target. Assessing the right point of excellence will ultimately rest on the data points. If in doubt, setting the point of excellence slightly higher than expected manages the financial risk.
In designing pay mixes for the sales roles, you will have articulated the right leverage for each role. For territory or account managers, the leverage factor is normally two times the on-target payout. This may be higher for new business reps (for example, 2.5 times the on-target payout) and lower for sales managers and directors (for example, 1.5 to 1.75 times the on-target payout). This means that as an account manager, if you are on a 60:40 pay mix, when you reach the point of excellence, you may effectively be at a 60:80 pay mix.
Should there be a performance cap?
The final challenge is whether to cap the payout curve. The Mercer study mentioned earlier indicated that where plans are capped, 20% have a soft cap and 60% a hard cap with the median level of cap being 200% of target.
Risk vs. return is the key point here. If you are a young company looking to grow, a cap will impede the growth drive. If you have a pipeline that is very lumpy and a mega deal will lead to overpayment, it would be advisable to introduce a windfall clause. A cap typically leads to either deals being sandbagged or your high performers spending the fourth quarter on the golf course. You want high performers to keep pushing.
A typical compromise is a soft cap where sellers continue to earn above the point of excellence at a lower rate. However, there are some capping options that don’t involve capping total earnings. For example, capping quarterly payout and “truing up” at the end of the plan year, capping specific deal sizes, or capping specific product-related payments may be alternatives to a hard cap.
In conclusion, the development of your payout curve needs to be data driven. History does not always predict the future, so there is a need to understand market trends and product and service potential. There is a critical dependency on target setting accuracy and pipeline predictability. The payout curve will set the expectation and motivation for the salesforce, so choose threshold values, points of excellence, and potential caps with care.
For more information and inspiration about sales incentivization, join us for our webcast with Sales Management Association on September 4, 2019, and see how payout curves fit with other key plan design principles to drive effective sales compensation.