February 2008
Michael Rose, Ph.D.
Concerned with overall sales perfromance, Charlie Delta Pharmaceutical (pseudonym) implemented new reporting controls, including a streamlined sales management dashboard. Integrating CDP’s corporate vision with sales strategy, the new dashboard provides insight into wholesale inventories, new product activity, and sales and volume by product.
CDP used the dashboard to streamline inventories, boost sales performance, and ultimately sell the firm at premium value to shareholders. This case study is a companion piece to the Sales Management Association’s Research Brief on Sales Management Dashboard Design. It includes a flash-based interactive version of CDP’s sales management dashboard (viewable by clicking in the illustration above; requires flash player to be installed. Download and install the latest Adobe Flash Player here).
Outcome
After reducing wholesaler inventory, improving sales performance, implementing reporting controls including a scorecard, the Charlie Delta Pharmaceutical was purchased at a premium value to shareholders.
Corporate Vision
Maximize Charlie Delta Pharmaceutical’s appeal to potential buyers, with the ultimate goal of selling the company.
Sales Objectives
Improve wholesaler inventory management and sales performance.
Sales Strategy
Emphasize new products and new prescriptions.
Tactical Goals
Reduce wholesaler inventory.
Scorecard Design Process
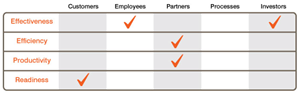
Our first step involves identifying those cells of the scorecard that appear most important to corporate objectives. Here, we learned that management was looking to improve corporate value (i.e. stock price) and maximize the organization’s attractiveness to potential investors. Hence, the cell crossing investor perspective with sales effectiveness was an obvious choice. While efficiency, productivity and readiness are important in improving investor confidence and stock price, management’s desire to sell the company at a premium places a greater focus on overall effectiveness.
Next, we know we have an issue with wholesaler inventory, so we check the boxes for partner-efficiency/effectiveness to make sure product is flowing smoothly through our channels. In the pharmaceutical industry, reports detailing wholesaler activity are readily available, so we know we’ll be monitor channel flow-through consistently.
Sales management wants to closely monitor metrics related to the performance of their sales team relative to our goals. So we also include the cell containing the most fundamental measure of performance, the “percent to plan†metric. Finally, we know that payer coverage of product is critical for sales growth, so we include the customer-readiness cell that includes the entities ultimately paying for the drugs, Medicare, Medicaid, the patient or third-party private insurer.
Balanced Scorecard Design
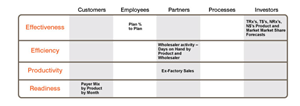
Once we’ve identified the scorecard cells we want to emphasize, we’re ready to populate these cells with metrics. Initially we’ll want to list all relevant metrics, and then pare back based on priority. In the pharmaceutical industry, we can readily obtain sales data from third party vendors like IMS and WK. This data reflects product and therapeutic class prescriptions all the way down to the prescriber level on a monthly basis. This data can easily be broken down by product and territory, and is ideal for our scorecard’s investor-effectiveness cell. Prescriber data can be further broken down into “new†vs. “total†prescriptions, which will tell us whether a doctor has issued a new prescription or the patient is filling an ongoing script. Plan numbers (goals or quotas) are also readily available and provide the metric for the employee-effectiveness cell. Finally, the wholesaler inventory report will provide the data for the partner-efficiency cell. These factors combine to create the following balanced scorecard matrix:
Dashboard Design
Once we’ve built the balanced scorecard matrix, populated it with metrics and eliminated those of negligible value, we’re ready to build a workable dashboard that executive management can use to evaluate performance. The scorecard, while essential to the process, is not necessarily an appropriate layout for the final dashboard. Typically, we insert the metrics into the table based on their logical arrangement and relevant timeframes. For example, sales and plan numbers will always be compared and are inserted next to each other for comparable time periods.
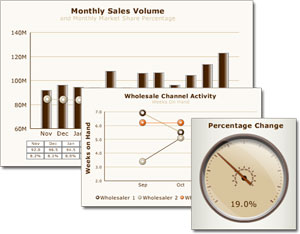
Graphs are particularly useful to show how data changes over time. Adjacent graphs showing product sales, market sales, market share and plan numbers are particularly useful for a quick snapshot of our overall performance relative to the market.
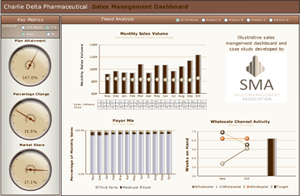
The flash-based interactive version of the Charlie Delta Pharmaceutical sales management dashboard (pictured above) is available here.
Note that our dashboard has a table showing overall performance for all products. We then created backup pages to track each product by SKU. Wholesaler inventory was included to facilitate a comparison of wholesalers along with goals at a glance.