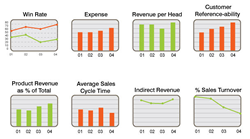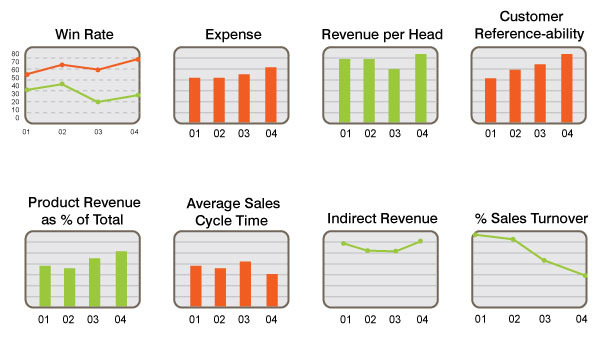
Tracking the right performance metrics is critical to any sales organization’s success. But getting the right performance results into the right manager’s hands represents a daunting challenge in a complex selling environment. A tool of pivotal importance in this process is the performance dashboard: an efficiently displayed summary of essential metrics offering a quick understanding of current performance. What should go into the dashboard? And who makes sure dashboard metrics appropriately reflect corporate strategy and objectives? One tool for bridging the gap between sales and corporate objectives is the “balanced scorecard,” a widely-used management system aligning corporate vision with business activities. In this paper and in the attached case study, we review how management can use the balanced scorecard as a critical design input for sales management dashboard development.
 The ApproachÂ
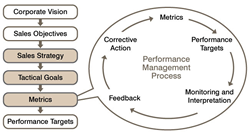
Corporate vision guides the development of metrics that represent an organization’s sales objectives, strategies and tactical goals. At the tactical level, these metrics serve as the primary vehicle for managing performance. Targets are set for each metric and performance monitors provide timely feedback and opportunities to initiate corrective actions
The first step is to identify the metrics that we want to build our scorecard around. We begin by creating a framework to organize and prioritize all the available metrics. This framework consists of two dimensions: a corporate perspectives dimension and performance dimension.
The corporate approach takes a 360 degree view of the organization from five distinct perspectives: customers, employees, partners, investors and internal processes. This approach is typically utilized in the “Balanced Scorecard†approach.1
Five Views of the Corporate OrganismÂ

A thorough examination of each corporate perspective is initiated, and appropriate individuals identified to provide a list of metrics appropriate for each sector. The sales performance dimension consists of four elements: readiness, productivity, efficiency and effectiveness. We define these elements in the graphic below and offer examples of metrics that exist within each element.

Once we’ve completed our fact-finding and categorized our metrics by corporate perspective and sales performance, we can create a matrix with these two axes and populate them with the appropriate metrics. Now we’re ready to create our scorecard.
The Scorecard Creation ProcessÂ

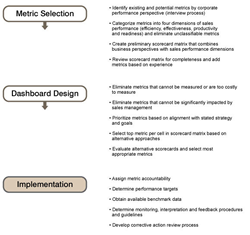
The scorecard is created in three steps: metric selection, design and implementation. The principles associated with each step are outlined below.
Metrics selected must meet one or more of the following criteria:
- Support stated objectives, strategies and goals
- Can be directly impacted by sales management
- Can be measured in a cost effective and timely fashion
- Reflect one of the four key dimensions of sales performance (readiness, productivity, efficiency and effectiveness)
- Enable performance benchmarking with industry competitors and best-in-class companies Scorecard design principles should accomplish one or more of the following objectives:
- Reflect senior management priorities
- Balance internal and external metrics
- Include measures of past performance and indicators of future performance
- Minimize the number of metrics in order to facilitate management interpretation The design process and detailed steps involved are outlined below.
Matrix Design

To facilitate scorecard design, create a matrix for the various metrics uncovered in the fact-finding process. Because each metric can be understood in terms of sales performance as well as a business perspective, the matrix combines business perspectives along the horizontal axis and sales performance dimensions along the vertical axis. Each metric is then placed within its most appropriate classification with respect to these dimensions. This tool has the following benefits:
- Creates a framework around the metrics selection process
- Balances business perspectives and sales performance views
- Provides a systematic approach
- Facilitates prioritization
- Allows identification of particular areas of emphasis
- Highlights areas with no metric coverage
Example Matrix:Â

Criteria for Eliminating MetricsÂ
Eliminate metrics that might be too difficult or costly to measure.
Example:
- The amount of effort exerted on business approvals Eliminate metrics that cannot be directly impacted by the sales organization
Examples:Â
- Customer’s growth rates
- Customer profitability
- Partner satisfaction
- Number of deals involving per partner
- Share of partner revenue by platform
- Partner’s profit margin
- Partner churn
- Rate of technology transfer
- Number of certified consultants
- Number of certified partners
Rules for Metrics PrioritizationÂ
Each cell in the metrics matrix may contain many metrics. These must be prioritized according to some basic rules:
- Alignment with stated strategy and goals – Use metrics that align with the strategy of the organization
- Frequency and intensity of emphasis during fact-finding – Use metrics that are emphasized in more than one corporate perspective.
- Experience – Use metrics you know from experience are important.
- Availability of benchmark data – Use metrics for which benchmarks exist Preliminary Scorecard
After the metrics matrix is completed, create a set of display graphics for the top metrics from each cell. Feedback from management can help determine if additions or alternative metrics are required.
Scorecard ImplementationÂ
After agreement is reached on scorecard design, the implementation process may begin. Effective scorecards require live data feeds and multiple data sources that may complicate the data integration process. Here is a list of the steps involved in implementation.
- Select final scorecard metrics
- Identify data sources
- Assess feasibility
- Assign metric accountability
- Develop an action plan
- Create a timeline
- Populate initial metrics
- Establish internal and external benchmarks
- Determine targets
- Determine procedures and guidelines for monitoring, interpretation and feedback
- Develop a corrective action review process
Best practice allows for online scorecards that can be customized to suit a particular user. For example, an online version of the matrix tool described above might give the user the option to select the metrics they were interested in and build their own scorecard. Additionally, users may want the ability to drill down to other levels in the organization (i.e. a district manager wants to see his district’s data).
In conclusion, designing an effective scorecard is a complex process, requiring detailed research, data integration, online application development and a comprehensive analysis of a corporation’s current position and its goals for the future. But the benefits far outweigh the costs, providing management with a methodology to track those metrics and the ability to use that information to guide the organization toward success.
Notes
- The Balanced Scorecard: Translating Strategy Into Action; Kaplan, Robert S., Norton, David P., Harvard Business School Press (September 1996).
- Designing a Metrics Dashboard for the Sales Organization; Mike Rose, SalesLobby.com (2002).


